ATP Serve Performances at the Grand Slams
 Photo by johnfo on Unsplash
2019 Serving Efficiency at Grand Slams
Recapping the 2019 Grand Slam season
With the conclusion of the 2019 Tennis season, the Big 3 (Nadal, Djokovic and Federer) all continued their domination during the largest stages of the season: the grand slam tournaments
Rafa Nadal cruised to the Roland Garros chip winning the final match in four sets against Thiem, while also capturing the US Open championship in a 5-set thriller over Medvedev.
Meanwhile, Novak Djokovic successfully defended his Wimbledon trophy against Roger Federer in a heavy-weight 5-set match, while also capturing the Australian Open chip against Nadal.
Finally, while Roger Federer did not win any grand slams in this 2019 season, he did reach the Wimbledon final as well as make some exciting runs at the other 3 grand slam tournaments. Not bad for the 38-year old Swiss!
How well did the Big 3 defend and break serves?
To analyse at a granular level how well the Big 3 performed during the 2019 grand slam tournaments, we look at their performances in defending their own service games and in attacking their opponent service games. A player who effectively defends their serve should win a high proportion of the games in which they serve first. Furthermore, a player who successfully attacks their opponents’ serve should win a reasonable amount of break points against their opponent’s serve.
To measure a players defensive and offensive ability, we look at the total number of service games defended, and the total number of opponents serves broken respectively. Moreover, to account for opportunity, we divide these metrics by the total number of player service games and opponent service games respectively.
Proportion of service games defended = # of service games won / Total # player of service games
Proportion of opponent service games broken = # of service games broken / Total # of opponent service games
What do the numbers say?
After some data cleaning and aggregating steps on match summary data found on Jeff Sackmann’s Github page, we produce the following table that combines the results from all 4 grand slam tournaments from the 2019 season.
| Player_Name | Matches_Won | SvGmsW_Prop | BPW_Prop |
|---|---|---|---|
| Rafael Nadal | 25 | 91.5 | 36.3 |
| Novak Djokovic | 22 | 88.6 | 36.4 |
| Roger Federer | 18 | 91.2 | 26.4 |
| Kei Nishikori | 14 | 80.2 | 29.5 |
| David Goffin | 11 | 79.2 | 30.5 |
| Daniil Medvedev | 11 | 82.3 | 26.7 |
| Roberto Bautista Agut | 11 | 86.5 | 25.8 |
| Alexander Zverev | 10 | 78.3 | 25.4 |
| Stan Wawrinka | 10 | 89.8 | 18.5 |
| Grigor Dimitrov | 10 | 85.5 | 22.9 |
During the grand slams Nadal, Djokovic and Federer are ranked 1, 2 and 3 respectively in terms of matches won. The other two columns we calculated represent the proportion of service games defended (SvGmsW_Prop), and the proportion of opponent serves broken (BPW_Prop).
Comparing the big 3 to other ATP players via Bubble plots
Using the two metrics (proportion of service games defended, and the proportion of opponent serves broken) we mapped out the defensive and offensive prowess of the Big 3 compared to the abilities of the other ATP players in the graphic below. We placed these two metrics on the x- and y-axis respectively. Additionally, to represent the success of the ATP players, we added an extra dimension that represents number of matches won by each player. The larger the bubble is, the more grand slam matches a player has won.
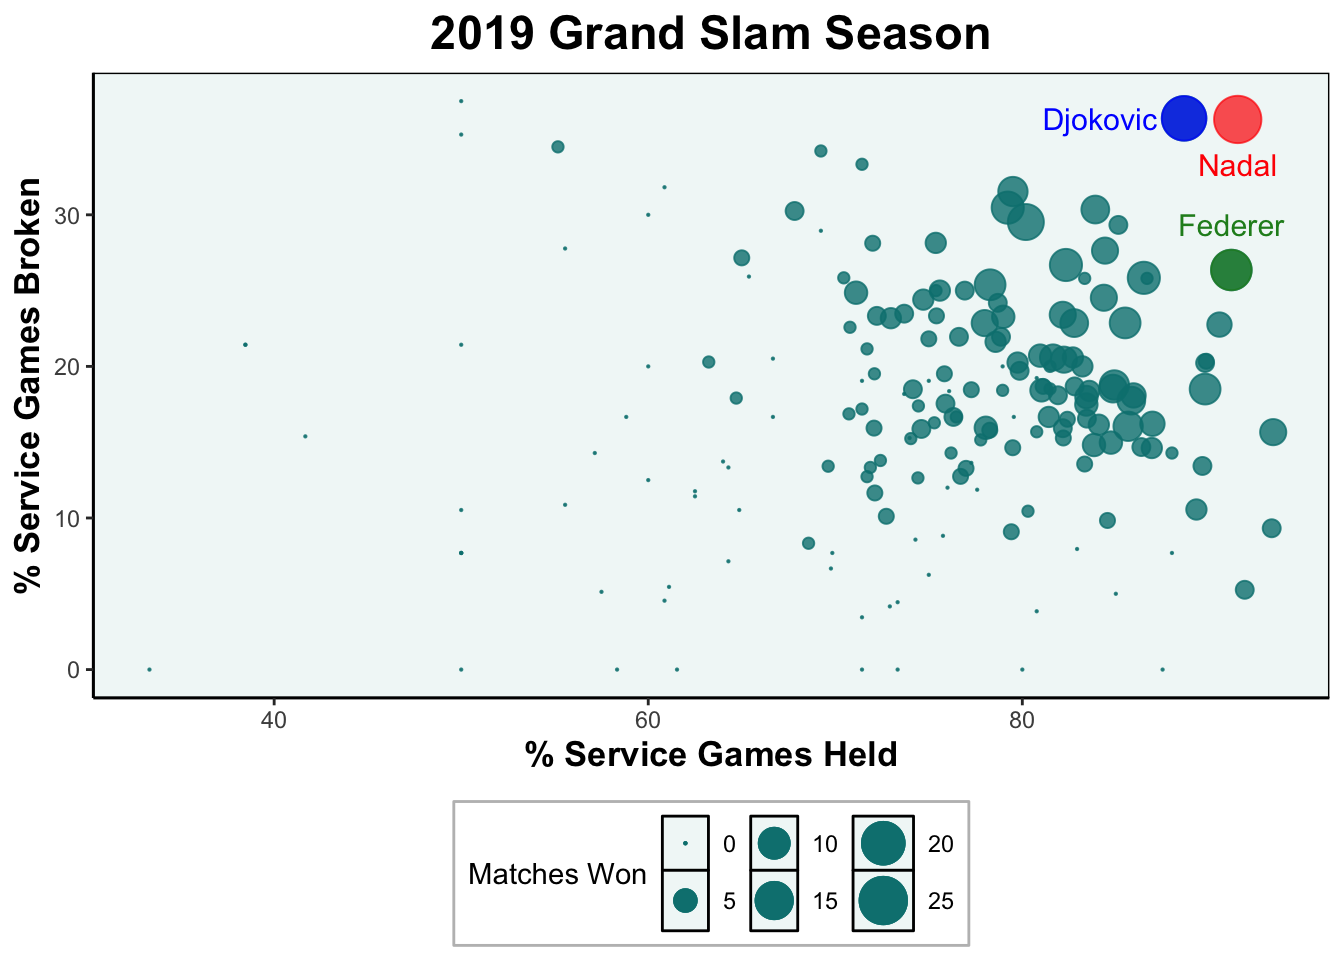
From the above bubble plot, we make some very intuitive remarks.
Larger bubbles are found on the top right corner of the plot. This indicates that players who are good at both defending their serve and at breaking their opponent serve tend to win more tennis matches. Unsurprisingly, since the Big 3 are good at both, their bubbles are found in the top right corner.
ATP players tend to be better at holding serve than they are at breaking their opponent’s serve. Many of the top players hold serve at a rate of 80%, while most players are unable to break their opponent at a rate of 25%.
ATP players that are very good at holding serve, but are average at breaking serve still tend to win a sizeable amount of matches. Conversely, players that do not defend their serve well, but who excel at breaking their opponent tend to not win many matches.
For those who like interactive plots as much as I do, I’ve produced the same plot using the R package gplotly.
All R codes to produce this analysis can be found on my Github page.